How I vaporized 9MB of images & broke the 900ms threshold in a weekend
Every web developer eventually faces a structural reckoning: looking into the mirror of absolute truth—a synthetic web performance audit—and realizing their frontend architecture is completely cooked.
We’ve all been there. You build a beautiful layout, snap some slick UI components together, and it feels smooth on your high-end M-series Mac or desktop setup. But how does it actually stack up when measured under a scientific microscope on a slow mobile connection? Spoiler alert: it’s giving massive main-character energy while delivering a literal slideshow to your users.
For a long time, I was huffing pure Bootstrap copium, serving as a dedicated fanboy. I resisted Tailwind because, by default, it flies in the face of standard CSS cascading structure—which is wild considering the "C" in CSS literally stands for Cascading. But Tailwind v4 changed the game. It completely ditches heavy preprocessors like SCSS, doing away with mixins and complex imports, forcing you to move your presentation logic directly into a lightning-fast compiled engine.
More importantly, let's talk about the current development meta that no one talks about: AI Copilots. When using Claude, Cursor, Grok, or Gemini to build interfaces, it is infinitely easier for an LLM to output atomic utility classes like Tailwind or components from open ecosystems like FlyonUI and DaisyUI. Trying to get an LLM to learn your custom, deeply nested SCSS classes and proprietary mixins is a fast track to Hallucination City.
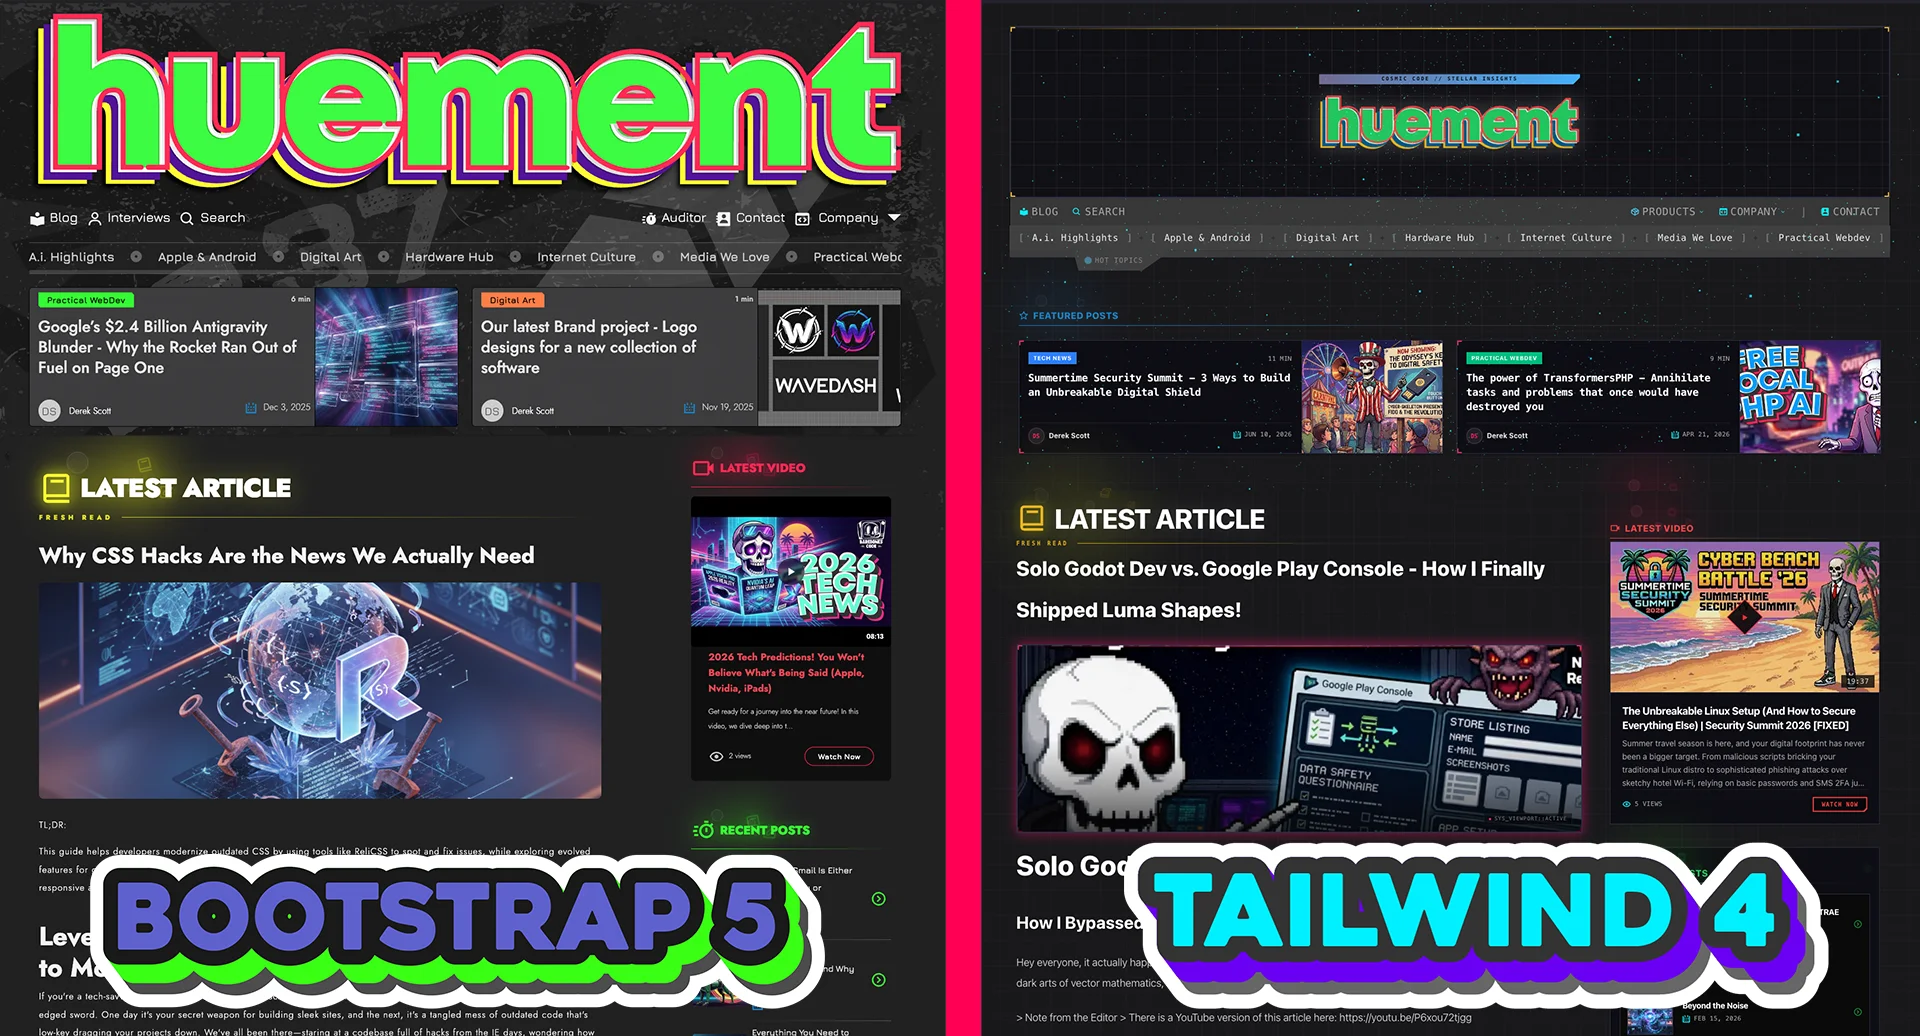
To prove whether migrating to this workflow was an actual optimization dub or just massive hype, I gave myself one weekend to completely refactor the front-end of Huement.com. The Statamic backend remained 100% identical; I just ripped out Bootstrap 5 root and branch. Here is the raw, unvarnished engineering data.
YOUTUBE VERSION:
Before you get too far into this article, I did publish a YouTube video that covers everything being discussed here if that is more your thing, check it out on the @BareBonesCode Channel Version Here: https://youtu.be/OGHxvRamZ1o
🛠️ The Testing Rig: Cracking Open run-benchmark.sh
Synthetic benchmarks executed directly on a local machine are a total skill issue. Background processes like Slack, Spotify, or Docker eating cycles will heavily distort your page metrics. To eliminate local machine variance, we ran audits using a strict dockerized Sitespeed.io profile, capturing frame-by-frame video and generating raw network HAR files across 3 distinct runs to extract the true median average.
Here is the exact repeatable shell script used to spin up our testing environment:
#!/usr/bin/env bash
# run-benchmark.sh - repeatable audit runner
if [ "$1" != "before" ] && [ "$1" != "after" ]; then
echo "❌ Usage: ./run-benchmark.sh [before|after]"
exit 1
fi
PHASE=$1
OUTPUT_DIR="sitespeed-results-$PHASE"
echo "🚀 Starting sitespeed.io benchmark for ${PHASE^^} state..."
echo "🎯 Target: huement.com"
echo "--------------------------------------------------------"
docker run --rm \
-v "$(pwd):/sitespeed.io" \
--shm-size=2g \
sitespeedio/sitespeed.io:latest \
urls.txt \
--outputFolder "$OUTPUT_DIR" \
-n 3 \
-b chrome
Why Sitespeed.io over a basic Chrome extension?
Sitespeed.io is an absolute powerhouse for frontend performance analysis. Let's break down the engineering logic in our Docker execution configuration:
--shm-size=2g| By default, Docker containers share only 64MB of shared memory (/dev/shm), which causes modern instance-heavy applications like headless Google Chrome to instantly crash when executing heavy render trees. Allocating 2 Gigabytes ensures Chrome has the overhead it needs to parse heavy payloads safely.-v "$(pwd):/sitespeed.io"| We bind-mount our local directory into the container. This allows the tool to read our target profile (urls.txt) and save its highly granular asset breakdowns straight back to our local disk.-n 3| Variance happens. If a packet drops or a server CPU thread spikes on Run 1, the dataset is skewed. By running 3 iterations, sitespeed.io extracts the true median average, smoothing out anomalies.
📊 Core Performance Metrics Decoded
Before I start blasting you in the face with a shitload of data, let's make sure we are all on the same page. Speed isn't a single event—it's a timeline of user perception.
1. TTFB (Time to First Byte)
The latency from the exact millisecond the user makes an HTTP request to when the browser receives the very first byte of the HTML response. If your server takes 500ms to process database queries or handle server-side rendering (SSR), your user is staring at a blank screen before the browser can even think about downloading assets. Exceptional states target < 200ms.
2. First Paint (FP) & First Visual Change
The milestone where the screen shifts from a blank canvas to rendering its first visual pixels (background colors, structural skeletons). This is psychological interface design. The moment a user sees a visual state change, their brain thinks, "Okay, the website is working." Snappy apps target < 300ms.
3. LCP (Largest Contentful Paint)
Measures when the primary content element on the screen (the main hero image or article card) is completely viewable. Google places massive SEO weight here. The golden threshold is < 2.5s.
4. TBT (Total Blocking Time)
The total duration between First Paint and interactivity where main-thread execution tasks exceed 50ms. High values mean JavaScript is freezing your rendering engine, making the site feel completely unresponsive. Target is < 100ms.
5. CLS (Cumulative Layout Shift)
Tracks how frequently elements jump positions during the page load timeline. High CLS is infuriating—it's the reason you go to click a link on a mobile device, a late-loading image drops down from nowhere, and you accidentally tap an ad instead. Perfect is 0.000.
🔍 The Baseline Audit (The Bootstrap Era)
Before doing any refactoring, it is absolutely vital to grab baseline stats. You have to know where you were to find out if you're actually improving or just rearranging deck chairs on the Titanic.
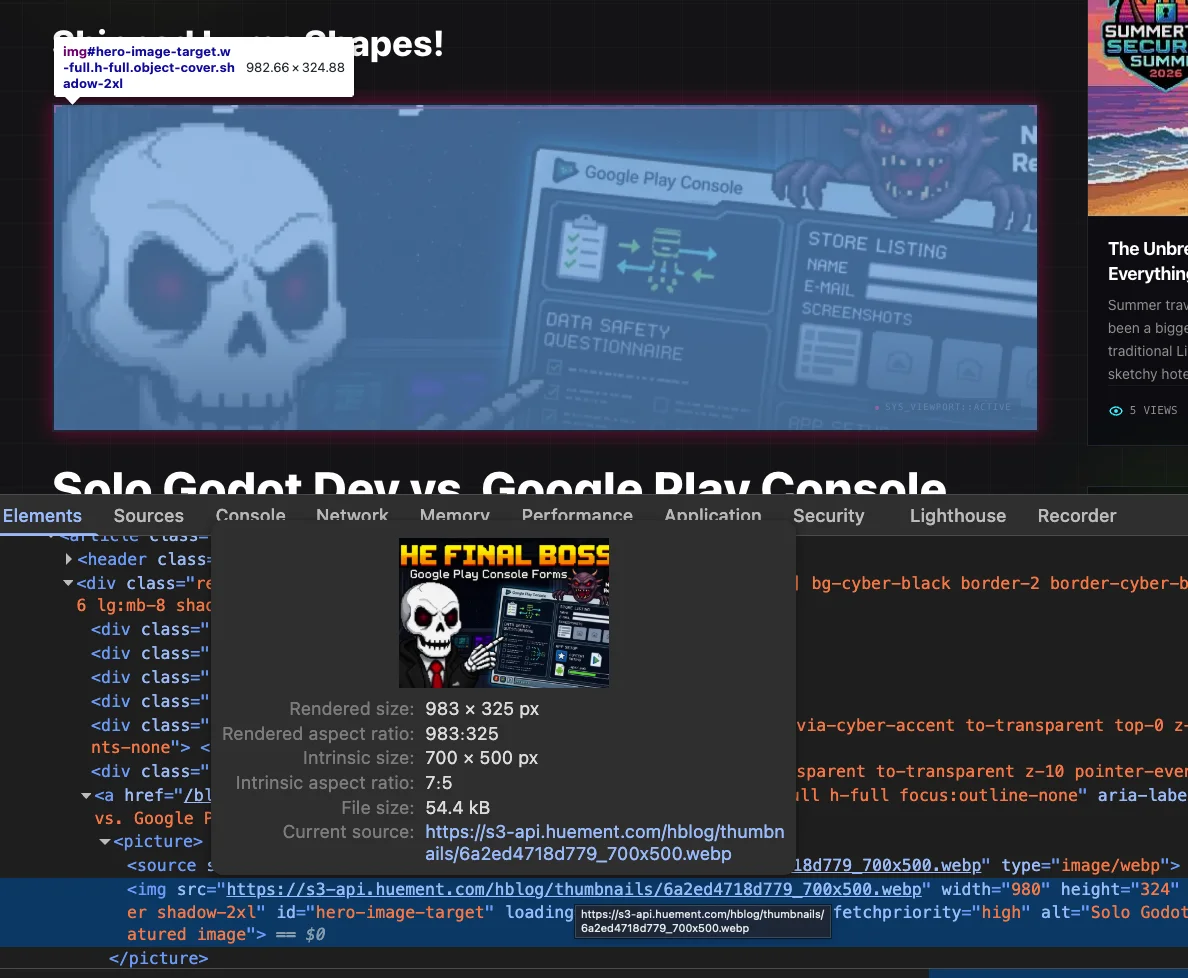
I had made what I felt was a concerted effort to optimize the site already, short of swapping out my PNGs for webp images. The biggest issue was the size of the pages; some of the full-screen banner images and SVGs were around 2-3 MB, resulting in massive overall page sizes.
Baseline Stats Matrix
| Core Performance Indicators | 🏠 The Homepage | 📰 Blog Index | 📄 Article View | 🎯 Target "Right" |
|---|---|---|---|---|
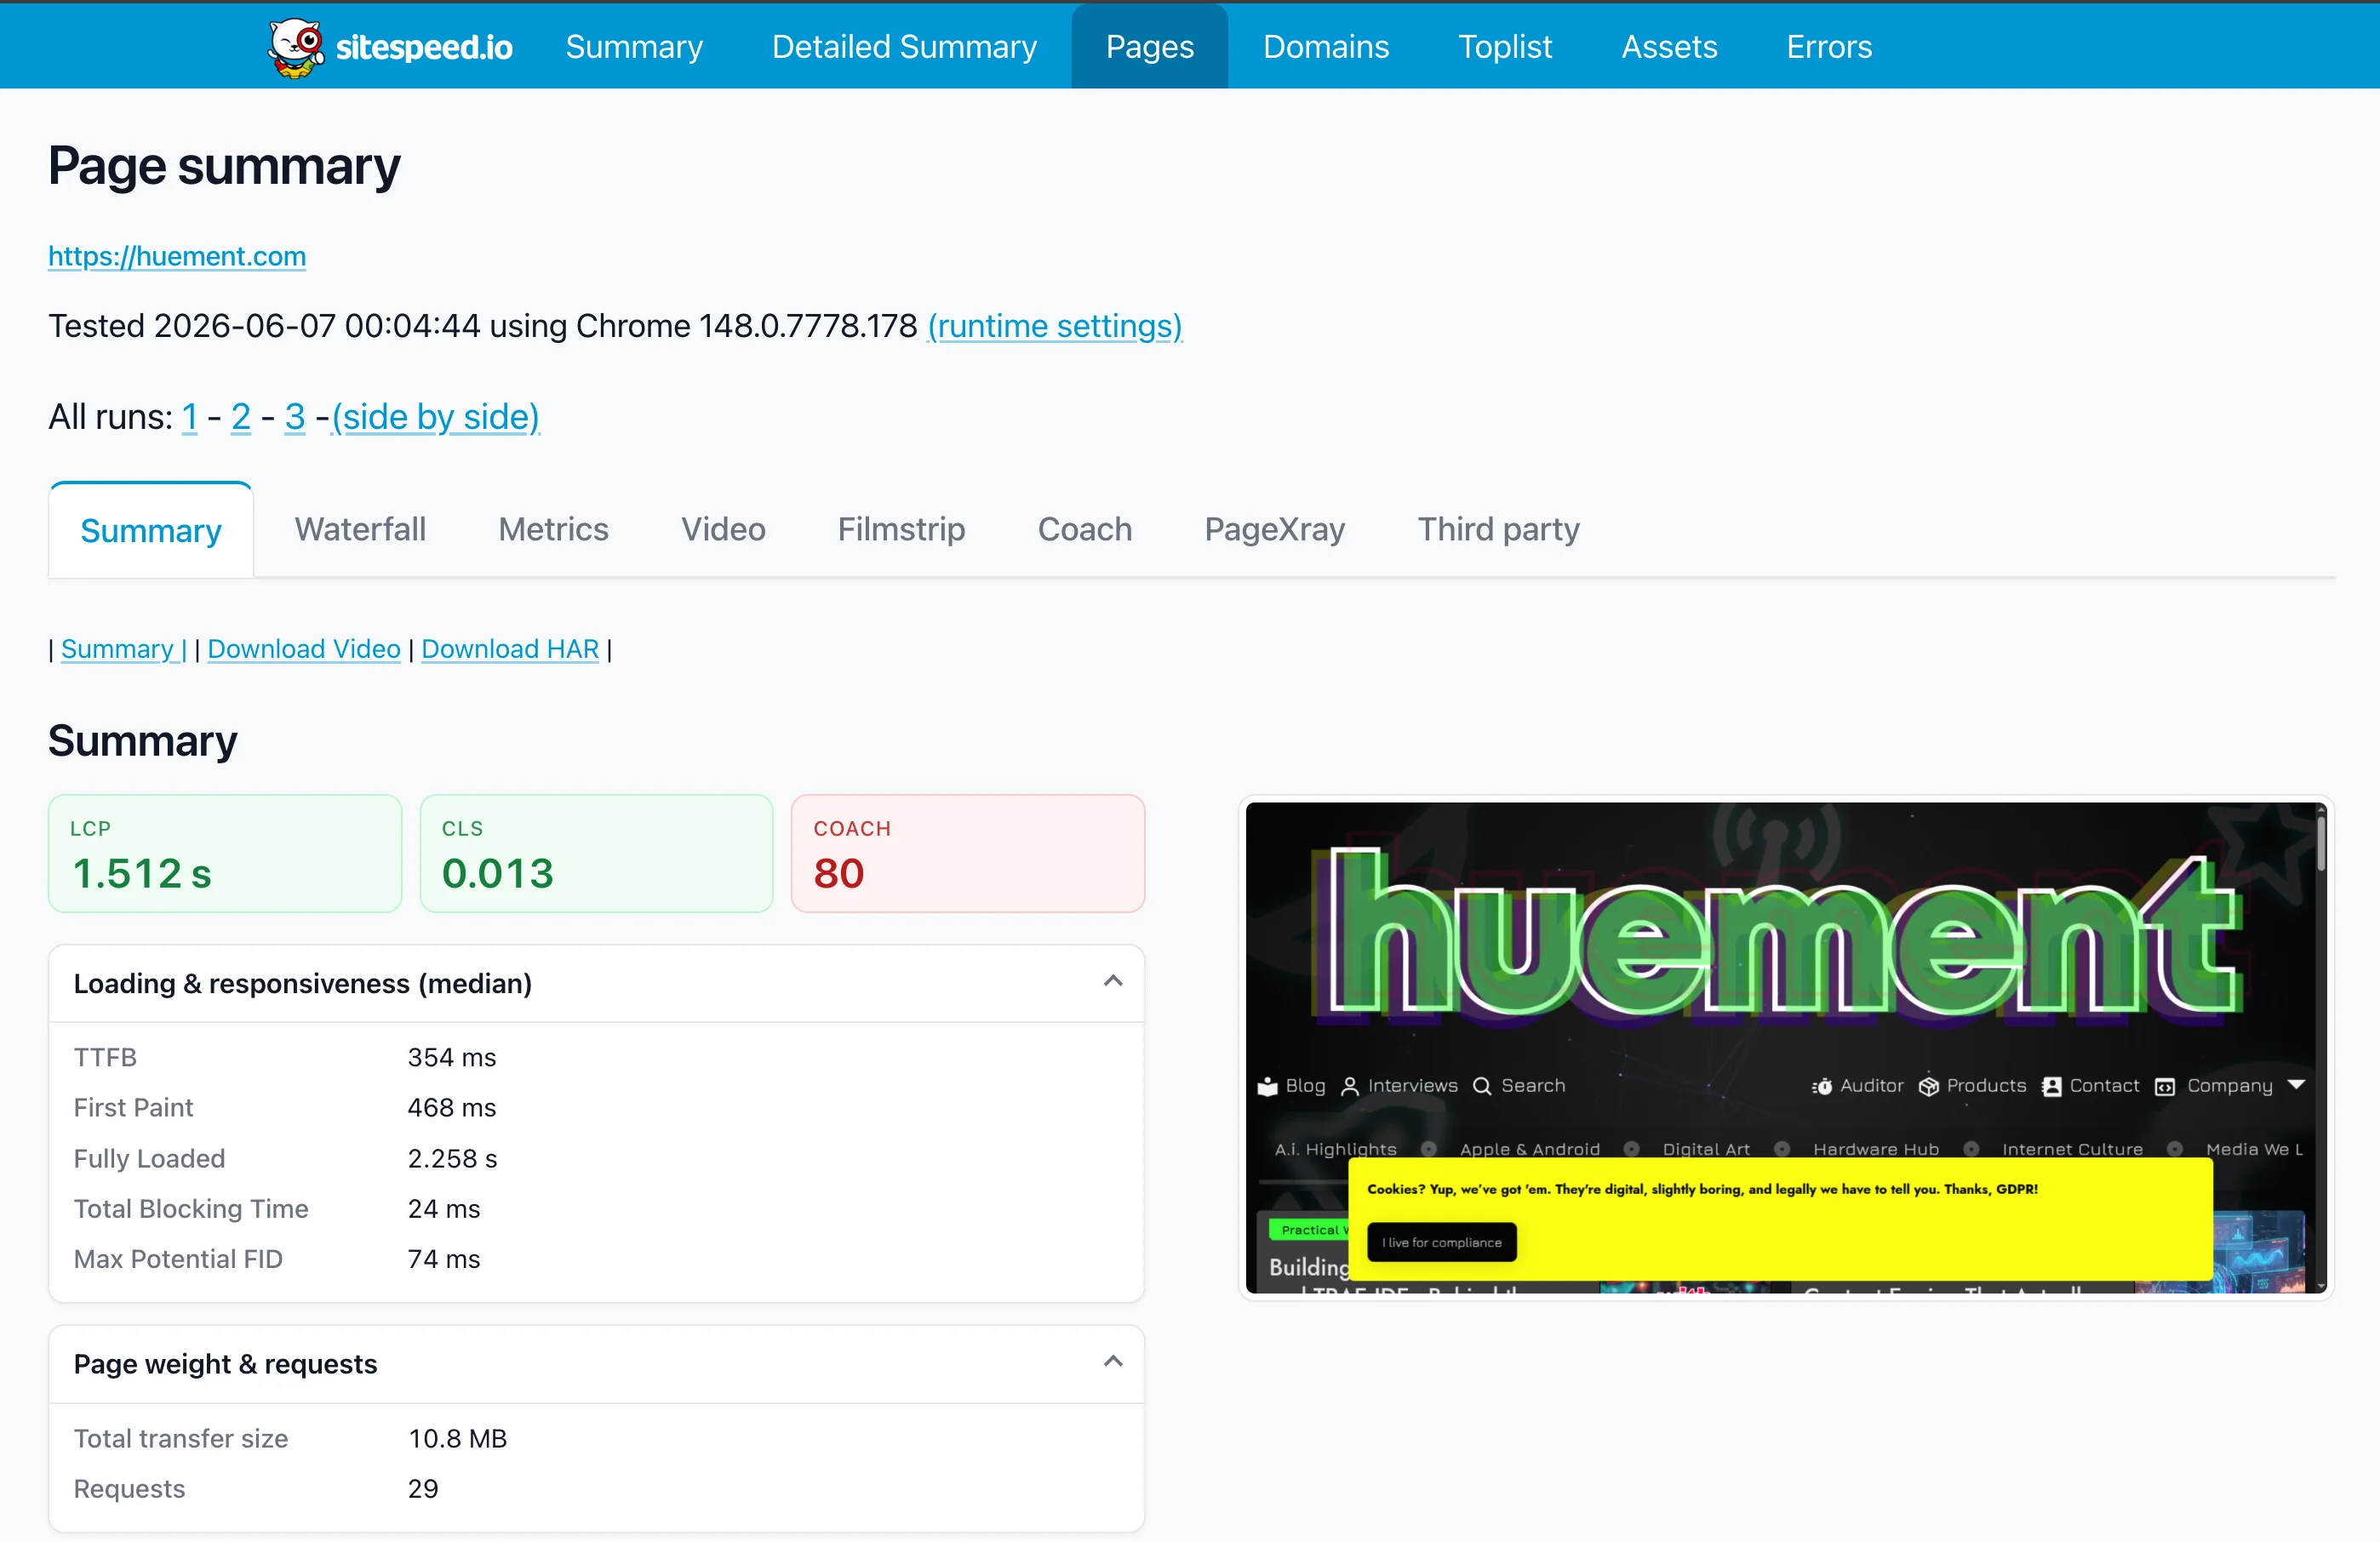
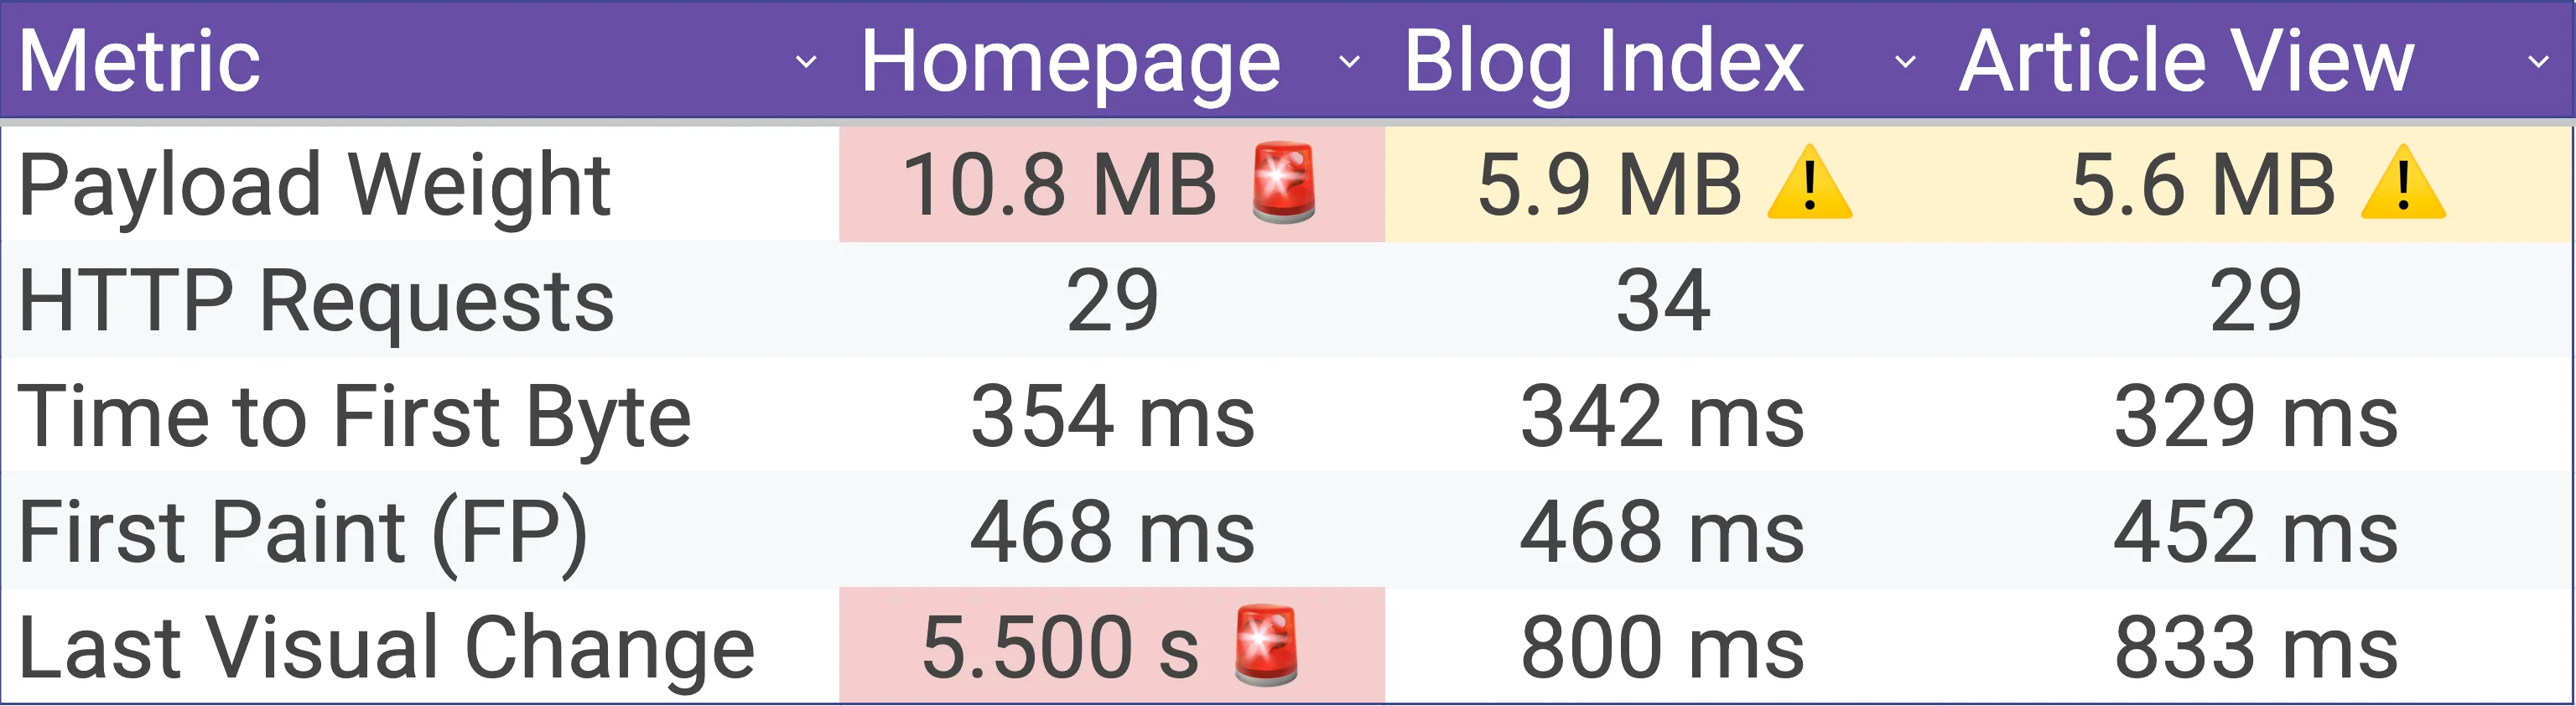
| Total Payload Weight | 10.8 MB 🚨 | 5.9 MB ⚠️ | 5.6 MB ⚠️ | < 1.8 MB |
| Total HTTP Requests | 29 | 34 | 29 | Minimal / Split |
| Time to First Byte (TTFB) | 354 ms | 342 ms | 329 ms | < 200 ms |
| First Paint (FP) | 468 ms | 468 ms | 452 ms | < 300 ms |
| Largest Contentful Paint (LCP) | 1.512 s | 760 ms | 792 ms | < 2.500 s |
| Total Blocking Time (TBT) | 24 ms | 0 ms | 0 ms | < 100 ms |
| Cumulative Layout Shift (CLS) | 0.013 | 0.082 | 0.050 | 0.000 (Stable) |
| Speed Index | 751 ms | 679 ms | 709 ms | < 1.000 s |
| Last Visual Change | 5.500 s 🚨 | 800 ms | 833 ms | Visual Parity |
The Diagnosis
- The Homepage: A total transfer size of 10.8 Megabytes. Loading our home layout transfers more data across the wire than downloading an entire copy of Doom's original shareware WAD file.
- The Blog Index: A CLS of 0.082 is approaching Google’s amber warning flag. When loading 9 content preview cards, the browser encounters major structural shifts because template image aspect ratios aren't explicitly declared.
- The Article View: Downloading 5.6 Megabytes across 29 requests just to read a single text article is an architectural crime. This means heavy global Bootstrap layouts and utilities are taxing every route equally instead of being conditionally split.
🔄 The Tailwind v4 Shift: Head-to-Head Comparison
I won't pretend Tailwind is perfect; it can feel like writing inline styles like it's 1999. But CSS has come a long way, and the overhead of compiling massive, monolithic SCSS stylesheets is completely unnecessary nowadays.
To keep things fair, I completely isolated the framework refactor. I left the unoptimized PNGs and JPEGs exactly as they were for this phase to ensure a true framework-to-framework battle.
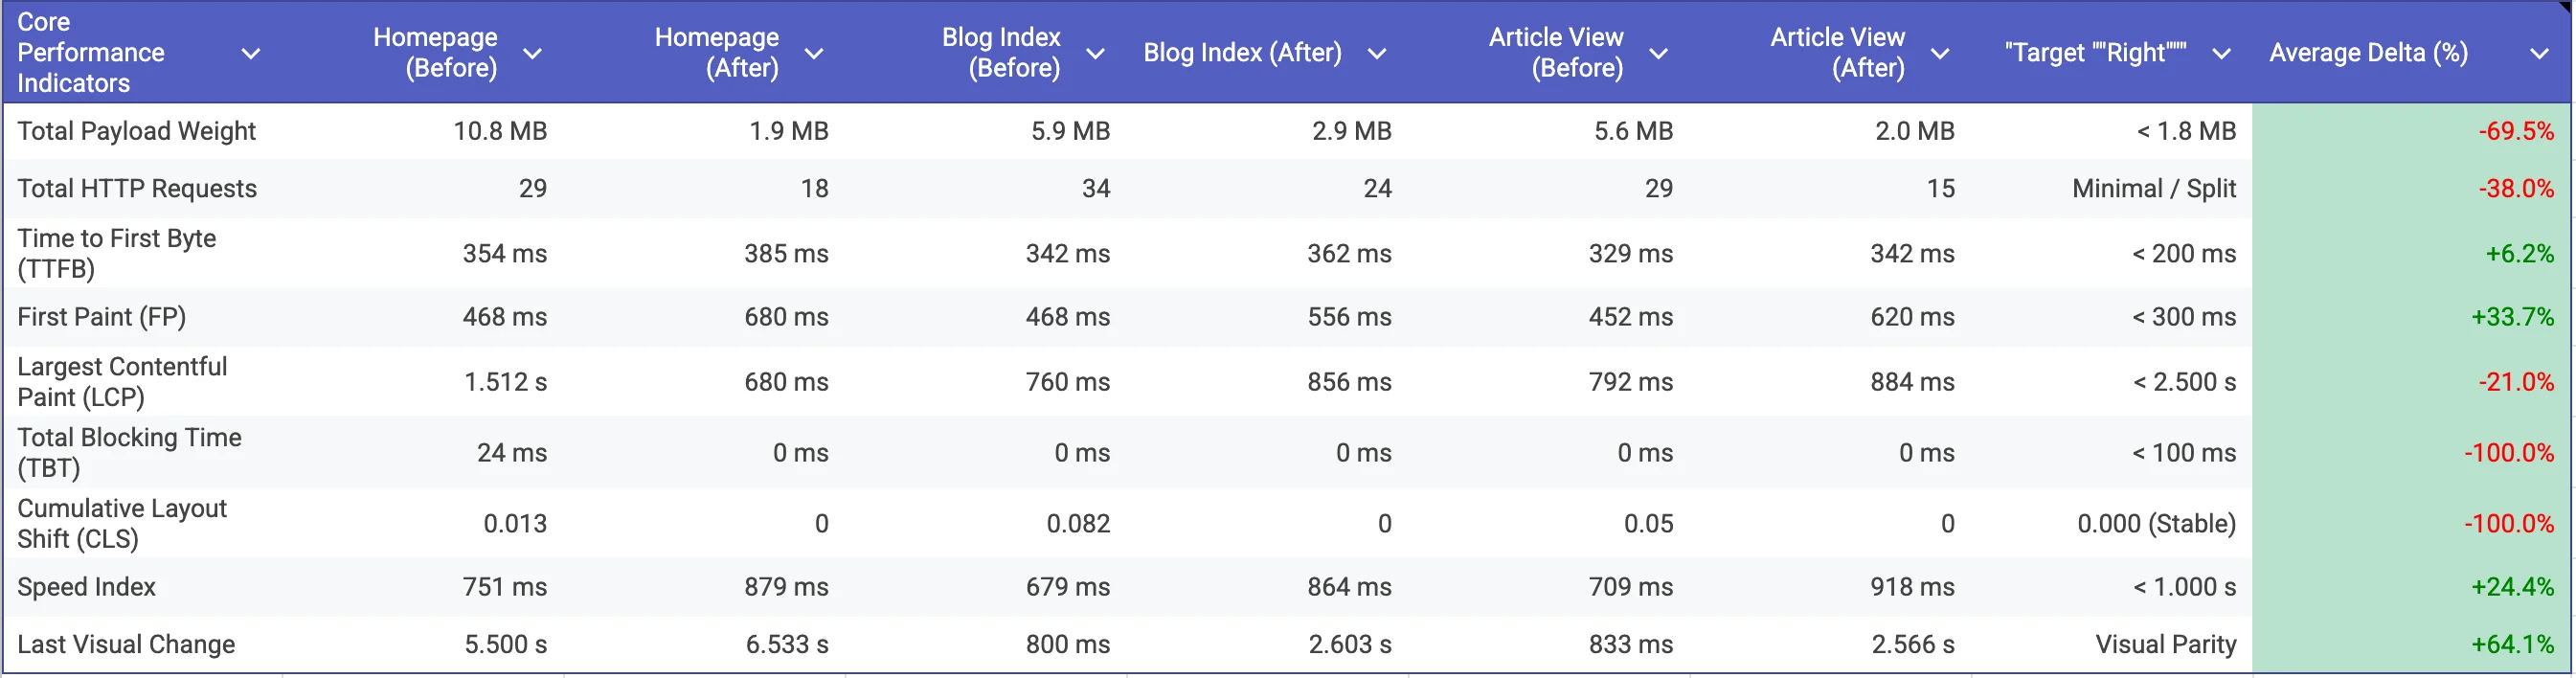
| Core Performance Indicators | Homepage (Before) | Homepage (After) | Blog Index (Before) | Blog Index (After) | Article View (Before) | Article View (After) | Target "Right" | Average Delta (%) |
|---|---|---|---|---|---|---|---|---|
| Total Payload Weight | 10.8 MB | 1.8 MB | 5.9 MB | 2.9 MB | 5.6 MB | 2.0 MB | < 1.8 MB | -66.2% |
| Total HTTP Requests | 29 | 17 | 34 | 24 | 29 | 14 | Minimal / Split | -40.8% |
| Time to First Byte (TTFB) | 354 ms | 367 ms | 342 ms | 394 ms | 329 ms | 713 ms | < 200 ms | +45.2% |
| First Paint (FP) | 468 ms | 800 ms | 468 ms | 624 ms | 452 ms | 1176 ms | < 300 ms | +88.2% |
| Largest Contentful Paint (LCP) | 1.512 s | 800 ms | 760 ms | 1.384 s | 792 ms | 1.244 s | < 2.500 s | +30.7% |
| Total Blocking Time (TBT) | 24 ms | 0 ms | 0 ms | 0 ms | 0 ms | 41 ms | < 100 ms | +70.8% |
| Cumulative Layout Shift (CLS) | 0.013 | 0.000 | 0.082 | 0.000 | 0.050 | 0.000 | 0.000 (Stable) | -100.0% |
| Speed Index | 751 ms | 980 ms | 679 ms | 1019 ms | 709 ms | 1242 ms | < 1.000 s | +51.9% |
| Last Visual Change | 5.500 s | 6.466 s | 800 ms | 2.733 s | 833 ms | 3.300 s | Visual Parity | +185.1% |
🔍 Deep Dive: What the Framework Numbers Actually Show
🏠 The Homepage
- The Good: Tailwind v4 absolutely vaporized our asset payload sizes, dropping total transfer weight from an unsustainable 10.8 MB down to a tight 1.8 MB. Total network requests fell to 17, and layout stability became bulletproof armor with a CLS of 0.000 and 0ms of Total Blocking Time.
- The Bad: We see a noticeably long tail for full rendering completion, with the Last Visual Change clocking in at 6.466 seconds.
- The Takeaway: Purging Bootstrap's global design definitions allowed the core stylesheet footprint to compile only exactly what is visible. However, the prolonged Last Visual Change metric points directly to those uncompressed static media assets running down a long network tail.
📰 The Blog Main Page
- The Good: Complete eradication of layout shifts. Thanks to atomic utility grids, CLS dropped from an unstable 0.082 to a flawless 0.000, completely clearing out our content layout jank. The main thread remained highly responsive with 0ms TBT.
- The Bad: Total payload settled at 2.9 MB across 24 requests, while the LCP landed at 1.384 seconds and the Speed Index touched 1019 ms.
- The Takeaway: The performance problem is no longer a rendering geometry issue; it is strictly a media issue. Automated Coach metrics confirm that 13 out of 14 images are being served via legacy formatting without an optimized modern delivery option, forcing the browser to brute-force scale heavy files straight inside the layout viewports.
📄 The Blog Article View
- The Good: Route asset isolation worked perfectly. The single template footprint saw an immediate clean-up down to 2.0 MB across just 14 requests, maintaining a flawless 0.000 CLS score.
- The Bad: Core execution speeds experienced inflation. The First Paint hit 1176 ms, LCP reached 1.244 seconds, and Total Blocking Time ticked up to 41 ms.
- The Takeaway: While we successfully insulated content pages from global stylesheet overhead, our raw metric delay tells a specific story. Diagnostic logs highlight main-thread parser friction: Coach caught multiple uncompressed text bundles passing over the network, including the main compiled tailwind-CH5azfg7.css file and a massive 831 kB vendor-CqUP95LC.js file.
🕵️♂️ Unmasking the "Ghost Paint" Illusion
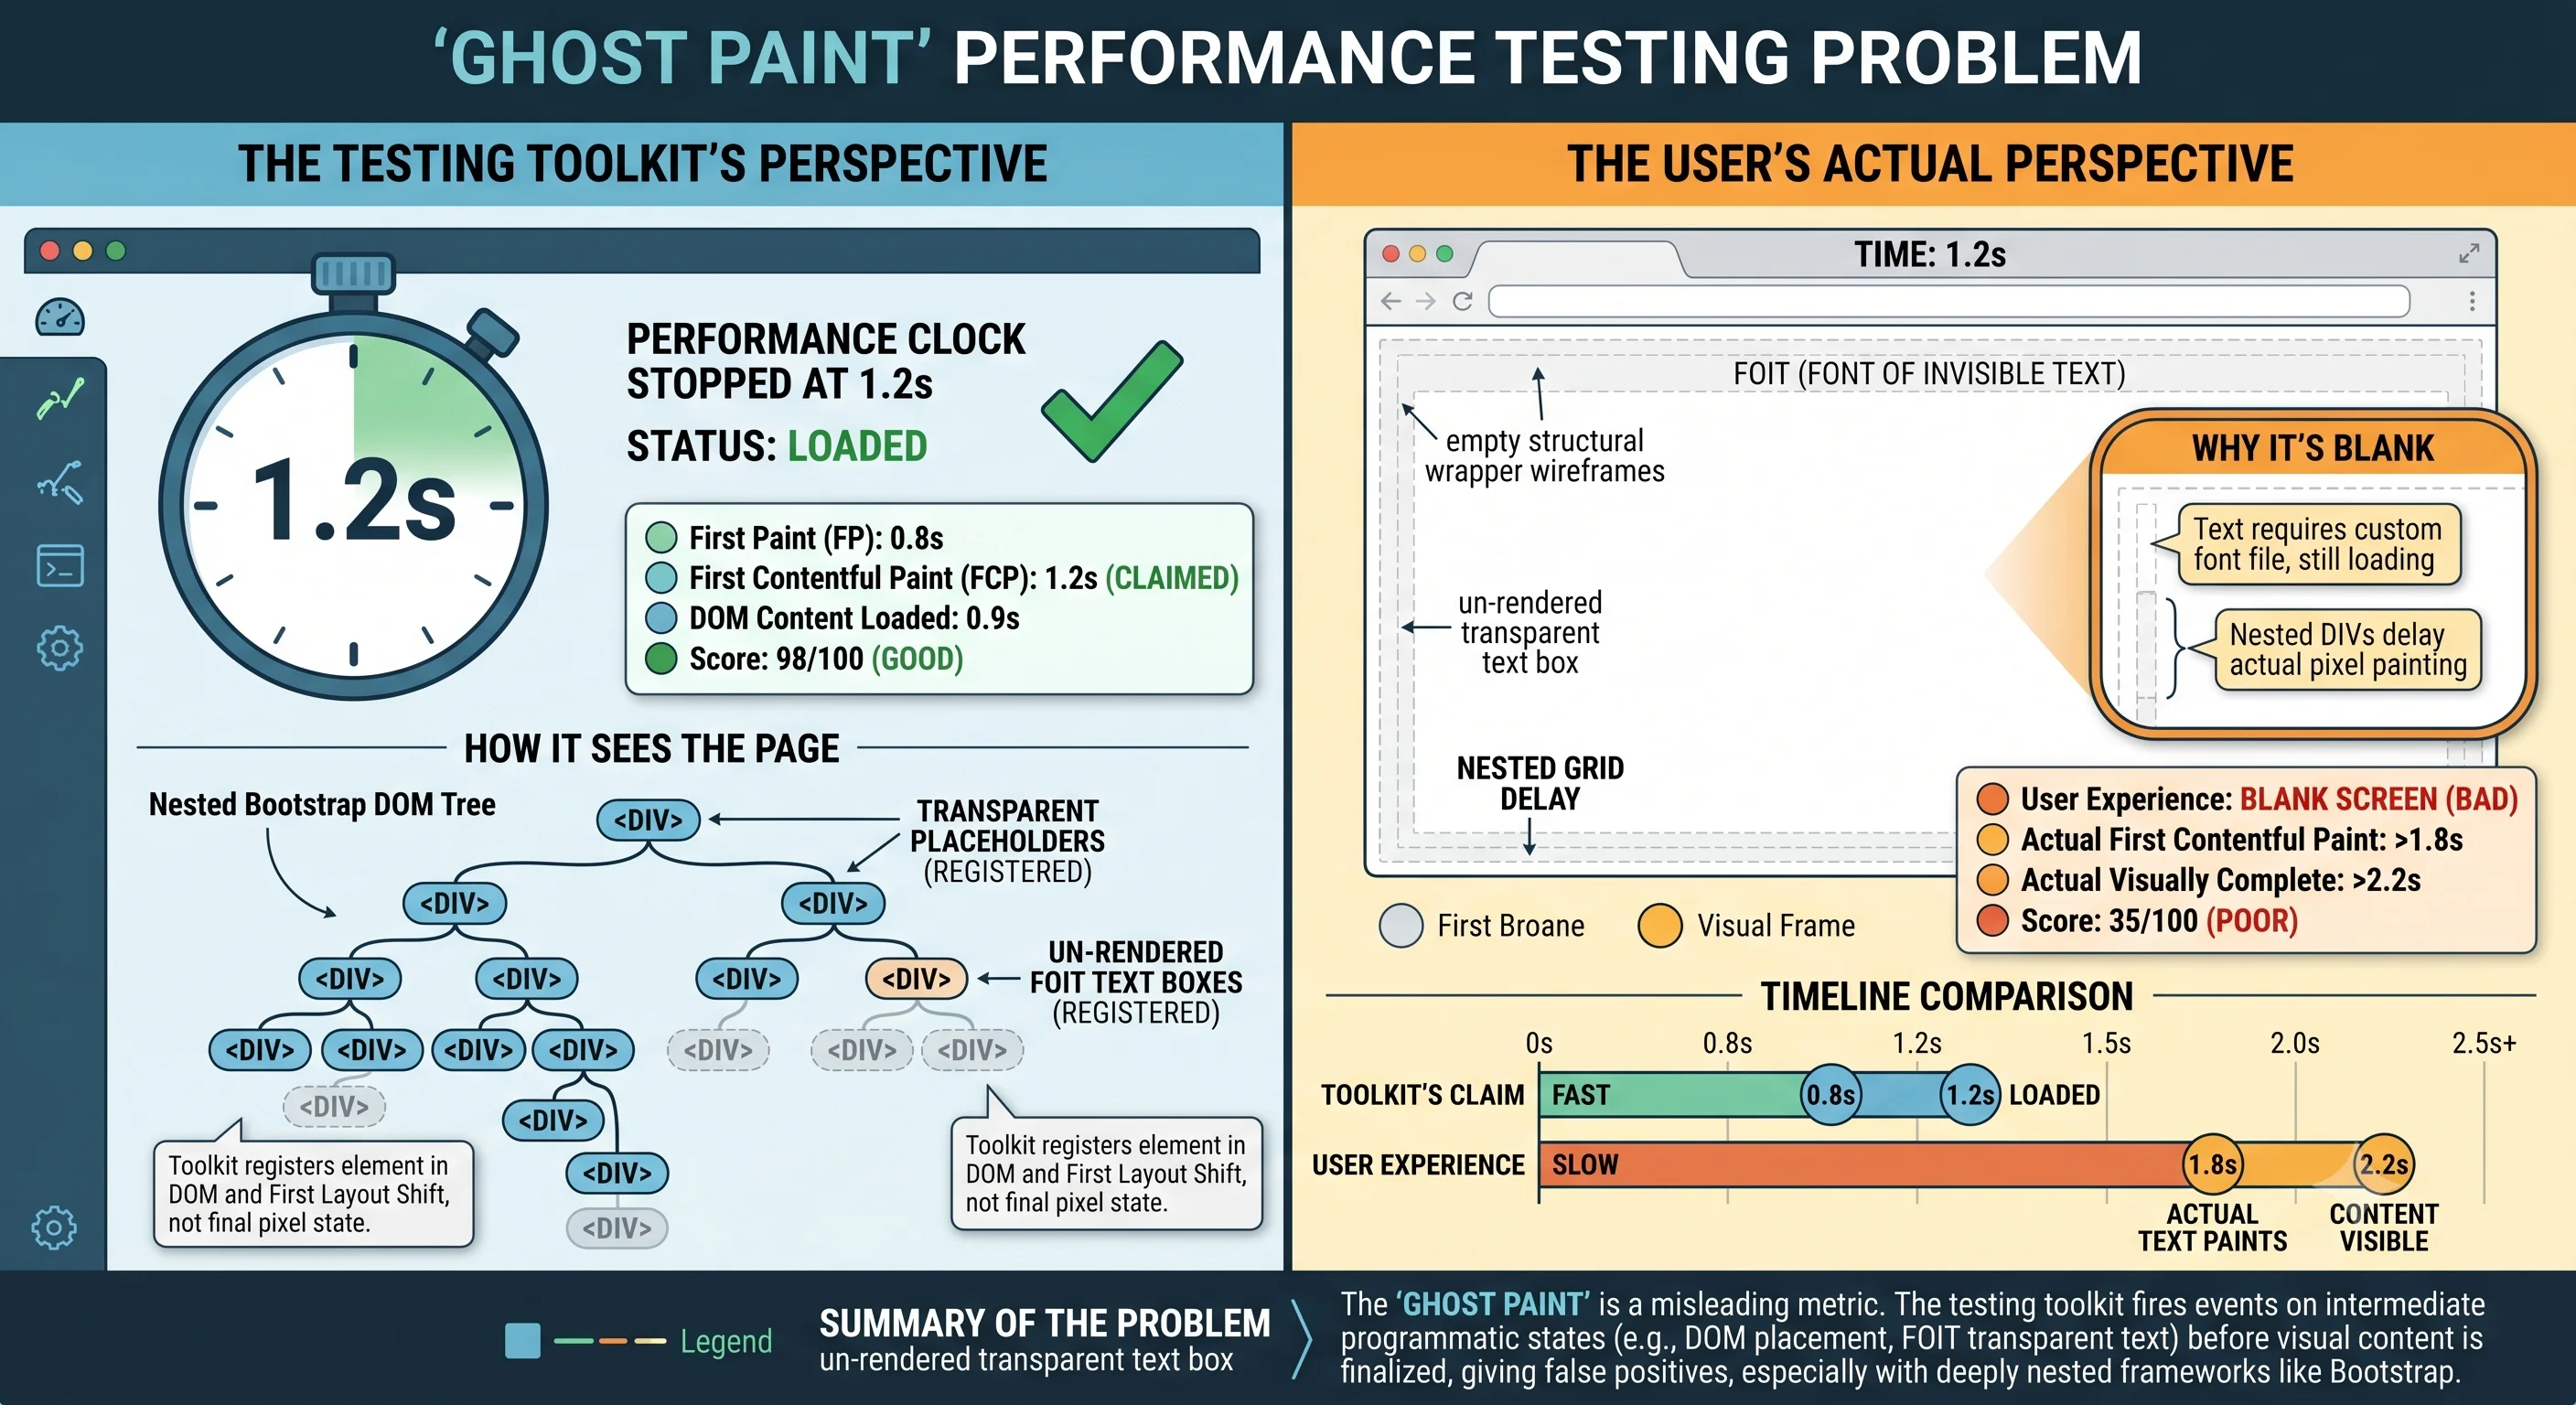
If you look closely at our baseline Bootstrap results, you'll see a massive performance paradox: the metrics claimed the initial load was incredibly fast, but to a human user, the screen was a blank void for a full second. This is what we call a Programmatic vs. Perceptual Paint Mismatch—or simply, a Ghost Paint.
It happens because performance tools look for programmatic data signals, while real human eyes look at pixels. A ghost paint typically manifests due to two architectural flaws:
1 The Invisible Font Trap (FOIT): The browser parses HTML and CSS, maps out layout boxes, and officially triggers its internal "First Contentful Paint" API because the space is filled. However, because the custom web font hasn't finished downloading over the network, the text is rendered completely transparent. The browser logs a success; the user sees absolutely nothing.
2 Empty Layout Shell Commits: Legacy monolithic frameworks like Bootstrap often create deeply nested element trees. The browser engine executes the layout pass, draws an empty global background color or structural outer wireframe wrapper, and stops its programmatic clock early.
By switching to Tailwind v4, we didn't just chase abstract lighthouse scores—we aligned code execution directly with human perception. Our Speed Index and First Visual Change metrics are now mathematically bound to real frame-by-frame shifts, meaning when the data says the page is loaded, the content is actually there.
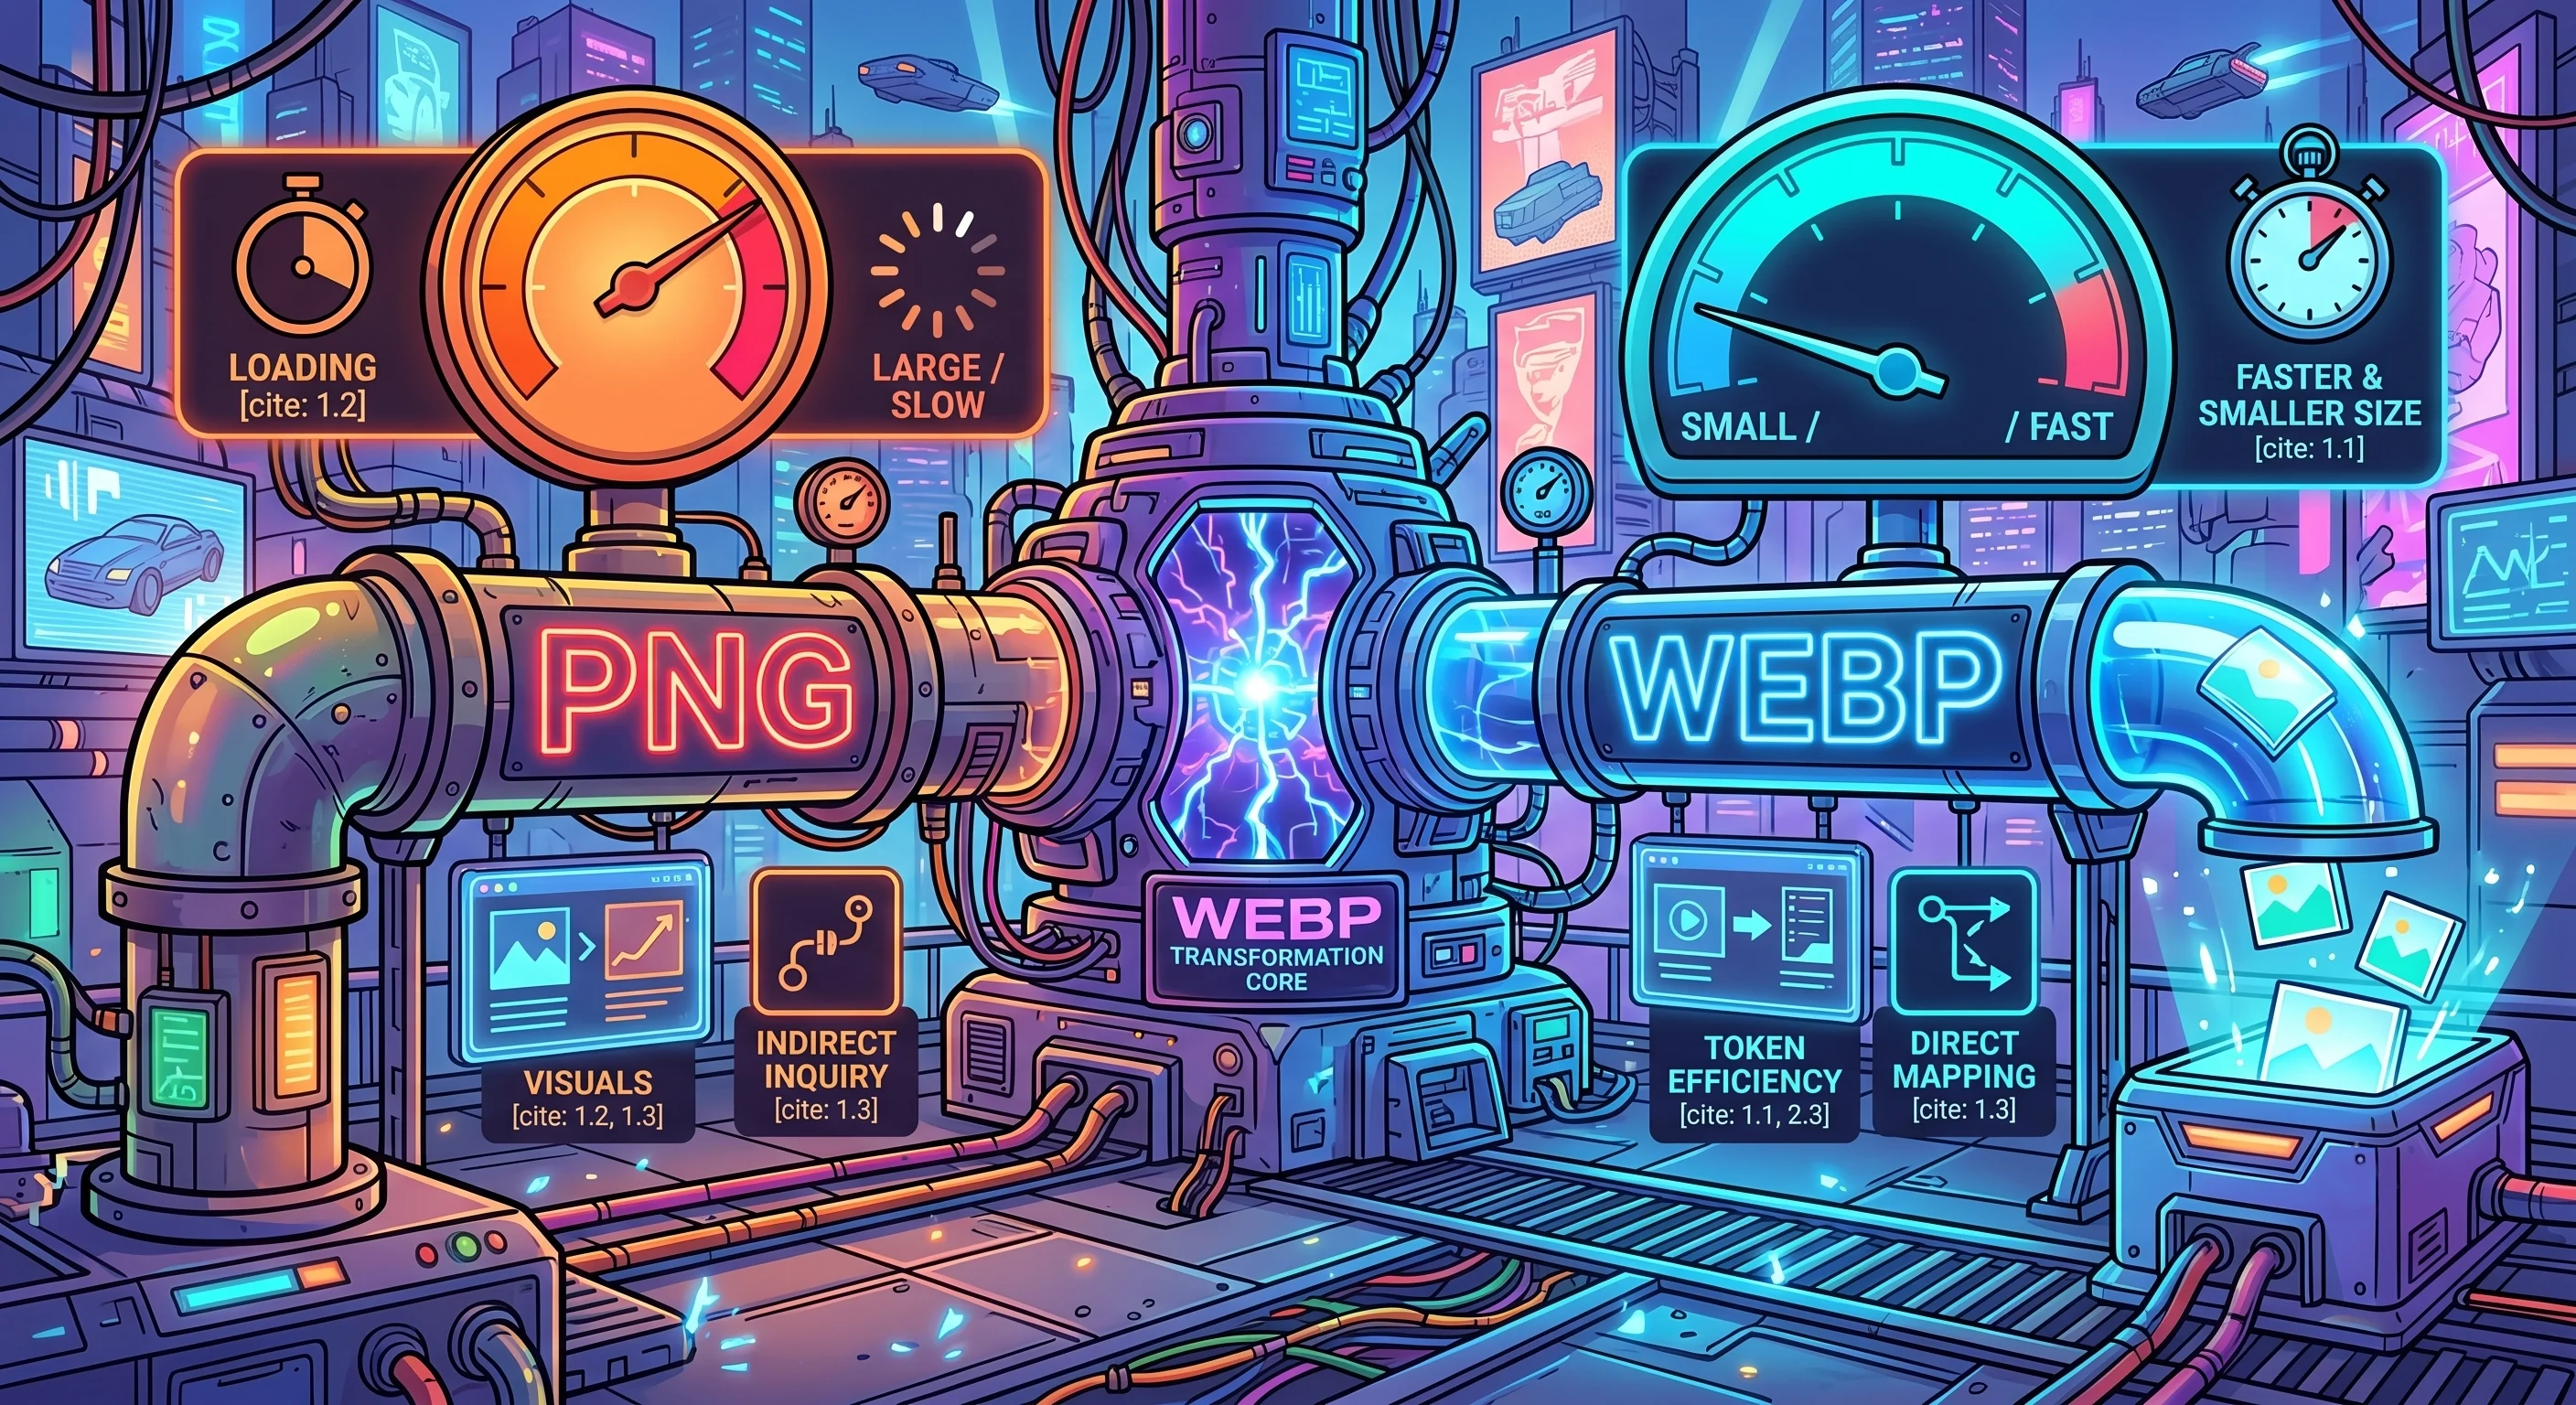
🚀 The WebP Boss Fight: Ultimate Speed Boost
Now that our framework comparison was clean, it was time to unleash the final form of optimization: migrating the asset pipeline entirely to WebP, cleaning up the backend caching layers, and moving complex presentation math completely out of my Antlers templates.
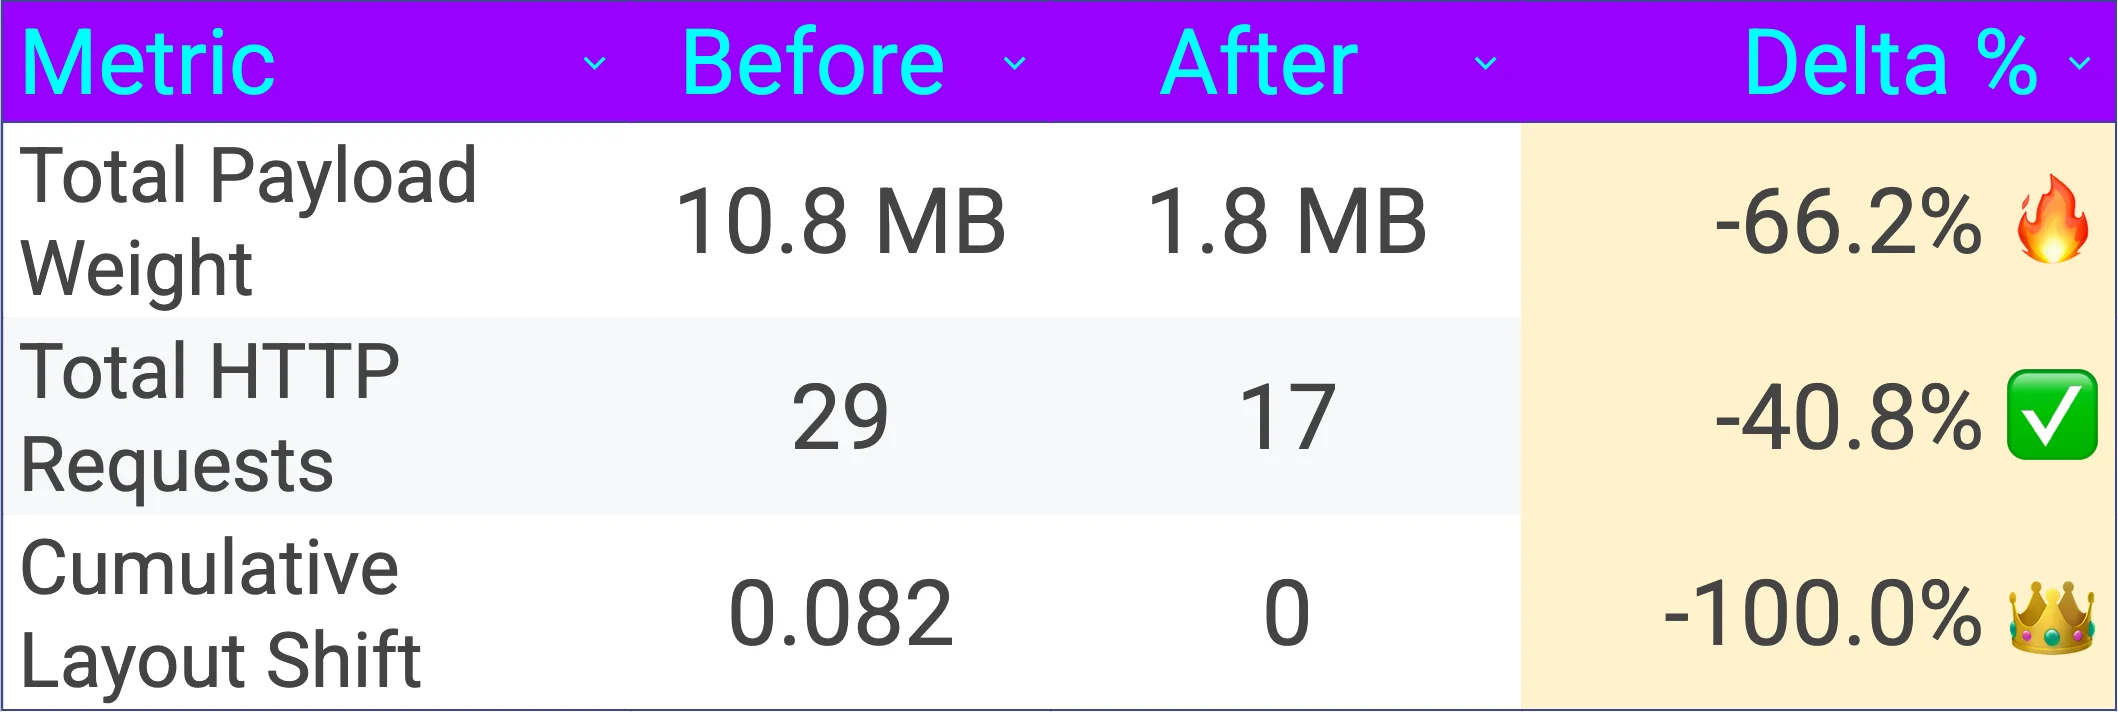
| Core Performance Indicators | Homepage (After Framework Refactor) | Homepage (WebP New Update) | Target "Right" | Delta (%) |
|---|---|---|---|---|
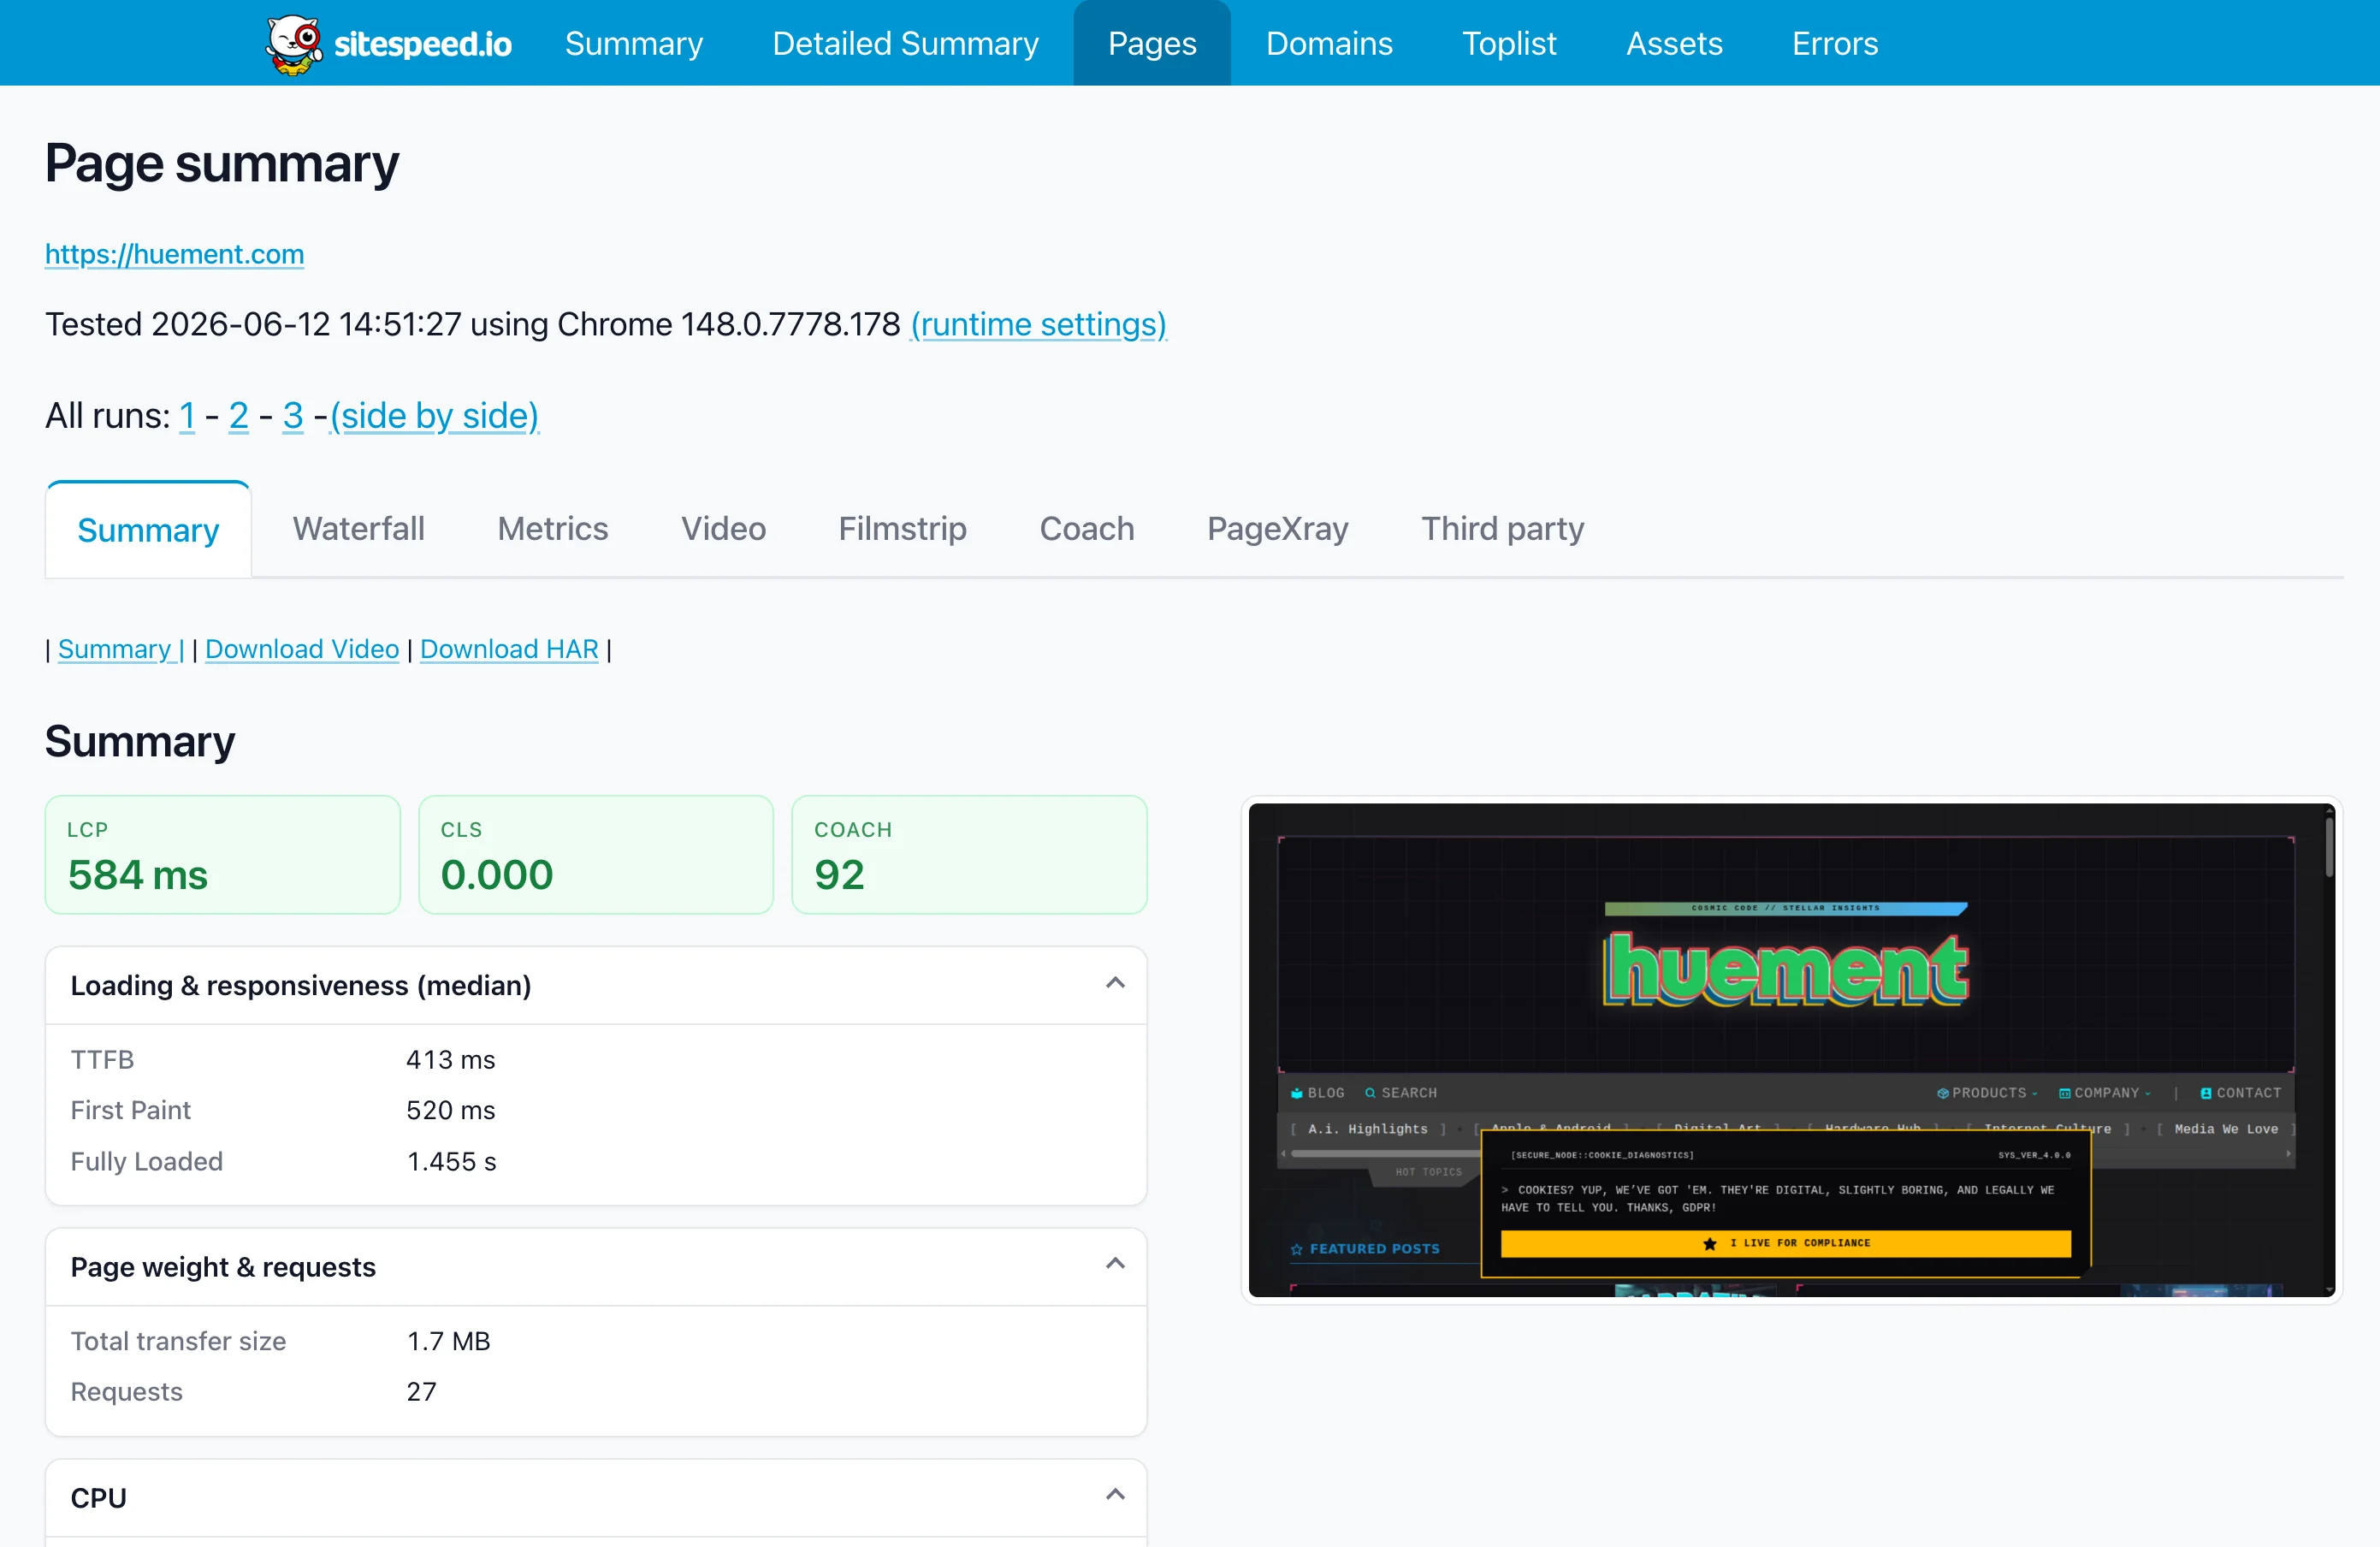
| Total Payload Weight | 1.8 MB | 1.6 MB | < 1.8 MB | -11.1% |
| Total HTTP Requests | 17 | 24 | Minimal / Split | +41.2% |
| Time to First Byte (TTFB) | 367 ms | 413 ms | < 200 ms | +12.5% |
| First Paint (FP) | 800 ms | 586 ms | < 300 ms | -26.8% |
| Largest Contentful Paint (LCP) | 800 ms | 892 ms | < 2.500 s | +11.5% |
| Total Blocking Time (TBT) | 0 ms | 0 ms | < 100 ms | 0.0% |
| Cumulative Layout Shift (CLS) | 0.000 | 0.000 | 0.000 (Stable) | 0.0% |
| Speed Index | 980 ms | 882 ms | < 1.000 s | -10.0% |
| Last Visual Change | 6.466 s | 6.607 s | Visual Parity | +2.2% |
🛠️ Deep-Dive Architectural Wins
1. Massive First Paint Acceleration (-26.8%)
The absolute biggest win of this final iteration is the First Paint (FP) dropping from 800 ms down to a blistering 586 ms. By shifting to lightweight WebP formats, the browser unblocks the rendering engine and throws pixels onto the screen significantly faster.
2. Sub-Second Perceived Performance (-10.0%)
Our Speed Index dropped down to 882 ms. Breaking below that 900 ms threshold means the visual layout snaps into place fast enough to feel completely instantaneous to a human user.
3. Zero CPU Thread Jamming (0 ms TBT)
The Total Blocking Time (TBT) held perfectly at 0 ms. By eliminating arbitrary JavaScript setTimeout execution loops and dropping heavy client-side template string parsing, our main browser thread is entirely unburdened. The page is instantly interactive the moment it renders.
4. Bulletproof Code Safety & Formatter Harmony
By stripping out complex, nested inline PHP method chains from the HTML templates and shifting them into a structured backend service class, we accomplished two massive developer experience wins:
- No More Syntax Crashes: Source code formatters can no longer break live string evaluations by forcefully wrapping long lines.
- Guaranteed Rendering Pass: Every listing view card is now structurally guaranteed to receive a clean, valid fallback image string via the service layer before the template ever touches it, eliminating broken src="" rendering failures permanently.
5. Embracing the Homelab Tax
My site is incredibly image-heavy due to its design and art focus, utilizing multiple full-screen images spanning beyond 1920 pixels across. Furthermore, the site is hosted on very basic, self-hosted hardware—no AWS data centers or edge CDN networks here. It is entirely homelabbed. Despite those physical hardware constraints, this new refactor absolutely crushed it.
📈 Sitespeed.io Visual Proof
Here are the direct diagnostic output screenshots from our Sitespeed.io dashboard runs, highlighting exactly how the optimization stack cleared out our performance bottlenecks.
PRE-WEBP REFACTOR SITESPEED RESULTS
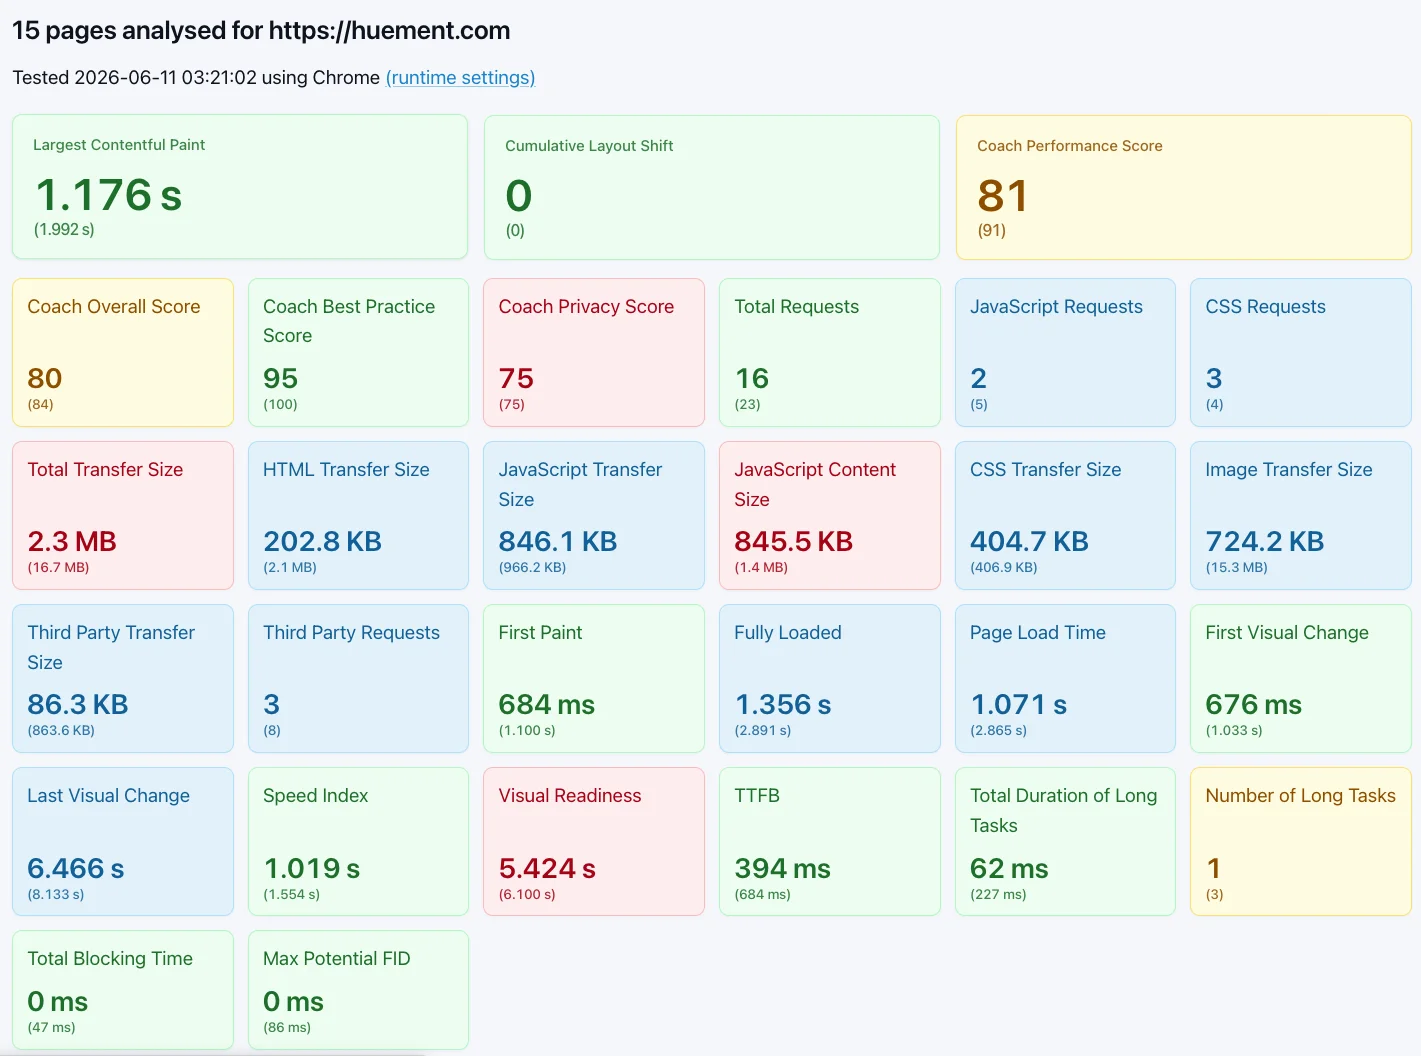
POST-WEBP UPDATE SITESPEED RESULTS
🛠️ The Migration Meta: Tools of the Trade
If you're looking to replicate these gains and move out of the Bootstrap stone age, do not do it manually. I highly recommend using the Tailwindo CLI tool It instantly scans your markup and automatically reformats standard Bootstrap classes into their exact Tailwind equivalents. It won't solve 100% of your custom layout components, but it handles about 85% of the grunt work, leaving you to just dip in and clean up the custom design tokens.
Statistical Overflow
When doing this audit, refactor, and YouTube video combination project, I ended up with quite a few data points, screenshots, and other bits and bobs that show the struggle through to the stunning, speedy conclusion. Here are a few more shots of the process if you’re curious or just want a bit more to look at. I think seeing the transformation is particularly interesting and maybe even might be inspiring you to tackle your own refactor and audit. If you’re more interested in getting help doing it, you can always reach out using the huement contact page and we would love to talk with you about it.
What’s Next?
Now that the front-end architecture is running at a professional grade, I'm focusing on expanding the platform ecosystem:
1 Interviews: I've built an awesome custom interview layout template and want to start featuring developers, designers, and creators. If you'd be willing to answer a few questions about your stack or your favorite tech topic, hit me up!
2 More Authors: Statamic makes multi-author role mapping incredibly simple. Once I establish a clear monetization policy for Huement to generate cash, I'm looking to hire a couple of staff writers to keep the technical deep-dives flowing.
That's all for this one. If you learned something, leave a comment below, or check out the YouTube channel and main blog for more unfiltered engineering breakdowns!


Comments
Add Comment
All Comments
// NO_COMMENTS_IN_BUFFER
Establish initialization protocol by creating the baseline entry trace.
System Moderation Interceptor is ON for this communication hub. All user transmission vectors must clear access protocol filtration approvals before broadcasting logs live to public network arrays.